By now you’ve must have heard of Google Data Studio. This really is a great free tool that every marketer should know about. Recently at Goodish Agency we hosted a Google Data Studio tutorial and provided our listeners with some useful tips. So if you want to learn more about GDS continue reading, check our tutorial, and learn why GDS is essential for your business.
Google Data Studio Tutorial
What is Google Data Studio?
Google Data Studio is one of many tools that we can use for reporting as it allows us to have multiple data sources on a single dashboard. This way our clients / Google Data Studio users don’t have to log in to every single platform they market on to see their reports but can find it all in one place.
Perks of Google Data Studio
The common problem marketers face is the overload of data in Google Analytics. It’s often not easy to find the data that’s truly important. This is where Google Data Studio comes in place. Using GDS you’re able to build your own dashboard and have complete control of what you see in your dashboard, meaning you can highlight data that’s truly important to your business.
Google Data Studio Templates & Dashboards
There’s a number of dashboards that one can use depending on their needs. Here are a few examples.
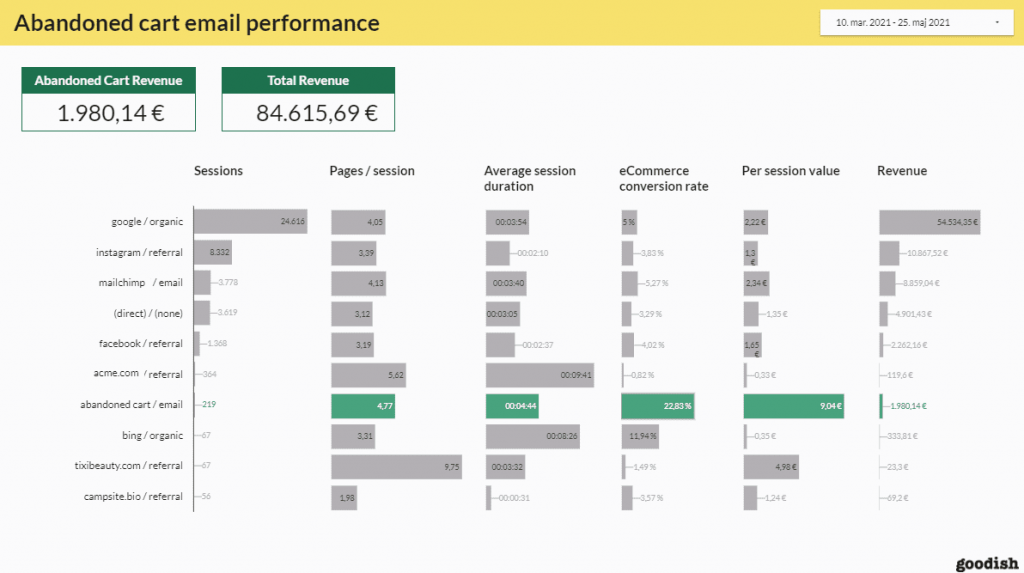
Analytical Dashboard

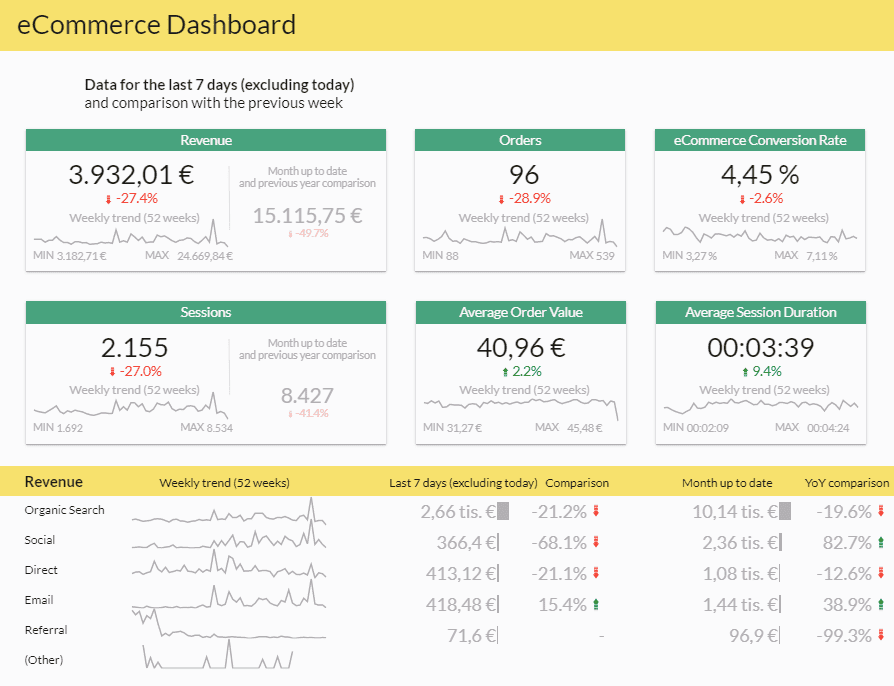
E-Commerce Dashboard - Performance Measurement

Ad-hoc Dashboard

Build Your Own Google Data Studio Dashboard
With just a bit of basic knowledge, connecting tables and making bespoke dashboards shouldn’t take you more than an hour. The process itself is pretty self-explanatory when you get into it.
We’ve noticed amongst many of our clients that when building a Google Data Studio dashboard oftentimes people tend to add too many segments, including those that aren’t necessary for their marketing goal. This can create confusion when trying to read the statistics. At Goodish we would recommend sticking with the classic charts and avoiding all the various fancy charts and pies which will inevitably cause confusion when trying to analyze them. In most cases, the classic charts are sufficient and already contain the essential information you’re after.
Feel free to skip the fancy charts in Google Data Studio. The classic charts offed in most cases already contain the essential information you’re after.
We hope you found this overview of Google Data Studio useful. If you’re ready to set it up, make sure to read more about it from the mother source. If you need a bit of help setting up your Data Studio dashboard, get in touch with Goodish, we’ll be happy to help!


