Google Analytics 4 (GA4) is different from the older version in several ways. The biggest change is how it collects data. It focuses on what users do (like clicking links or watching videos) rather than just counting how many times they visit a site. This gives you a more detailed view of user behavior.
Why is this important? If you run a website, work in marketing, or are interested in data, GA4 helps you see not just how many people visit your site, but what they do there. This information is important for making your website or app better and more user-friendly.
In this blog, we’ll explain how to set up GA4, how to find your way around it, and how to understand the data it gives you. We’ll also talk about some of the new features in GA4, like better privacy controls and new ways to predict what customers might do in the future.
If you’re feeling overwhelmed by GA4, our team has extensive experience with GA4. We’re well-equipped to guide you through its complexities and optimize its use for your needs. For expert GA4 assistance, contact us at Goodish Agency.
Understanding the GA4 Interface
Google Analytics 4 introduces a fresh interface designed to make your data analysis both efficient and insightful. If you’re new to it, understanding its layout and features is the first step to becoming a pro. Let’s break down the key sections of the new interface and share some tips for navigating them.
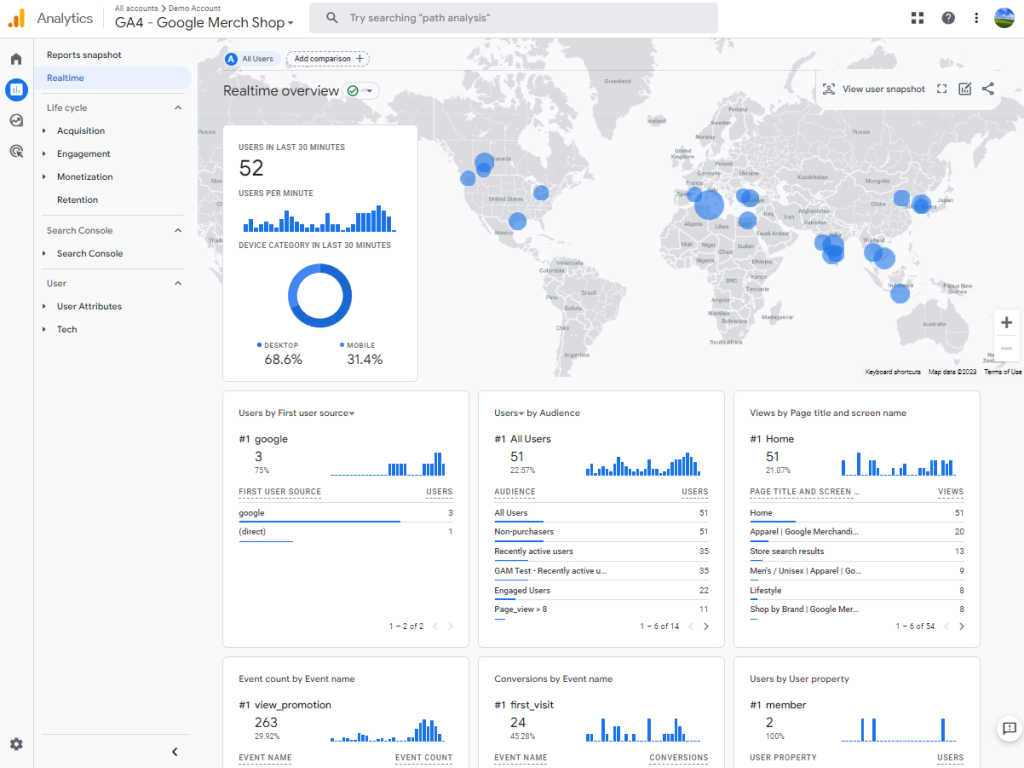
1. Real-Time Data
This section is like a live window into your website or app. It shows what’s happening right at this moment. You can see how many users are online, what pages or products they’re looking at, and even their locations.
Tip: Use Real-Time data to check if new content or a marketing campaign is attracting immediate attention.
2. Reports
Reports are where you’ll spend a lot of your time. This section provides detailed information about user behavior, like which pages are most popular, how long people stay on your site, and the paths they take through your content.
Tip: Start with the overview report to get a quick snapshot of your site’s performance, then look into specific reports for more detailed insights.
3. Explore
In the Explore area, you can create custom reports and analyze data in ways that aren’t available in the standard reports section.
Tip: Use Explore when you have specific questions about your data that standard reports can’t answer. It’s great for advanced users who want to have a more detailed look.
4. Advertising
If you’re using Google Ads or other advertising tools, this section is important. It shows how well your ads are performing, how many users they’re bringing to your site, and how these users behave once they arrive.
Tip: Regularly check this section to make sure your advertising budget is being used effectively and to make adjustments as needed.
5. Configure
Configure is the control center for your GA4 setup. Here, you can manage data streams, set up conversion events, and adjust user and event properties.
Tip: Take some time to properly set up this section. Accurate configuration is key to ensuring that you’re collecting the right data.
Setting Up and Configuring GA4
Setting up your GA4 account is crucial for effective data tracking. It’s about creating your account and configuring it to suit your needs. This initial setup is key to getting accurate insights about your website or app.
1. Setting Up a GA4 Account
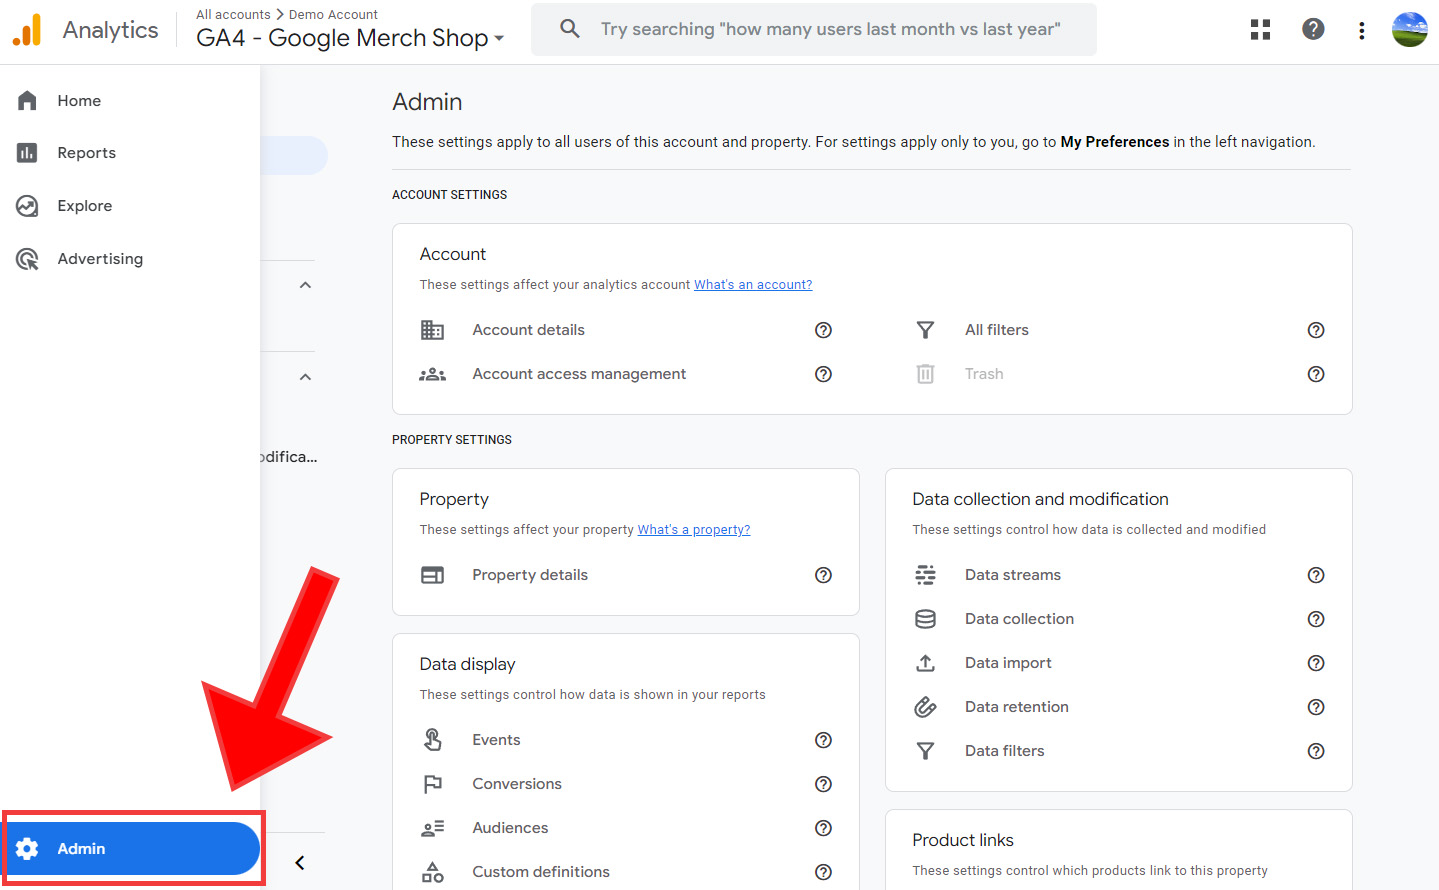
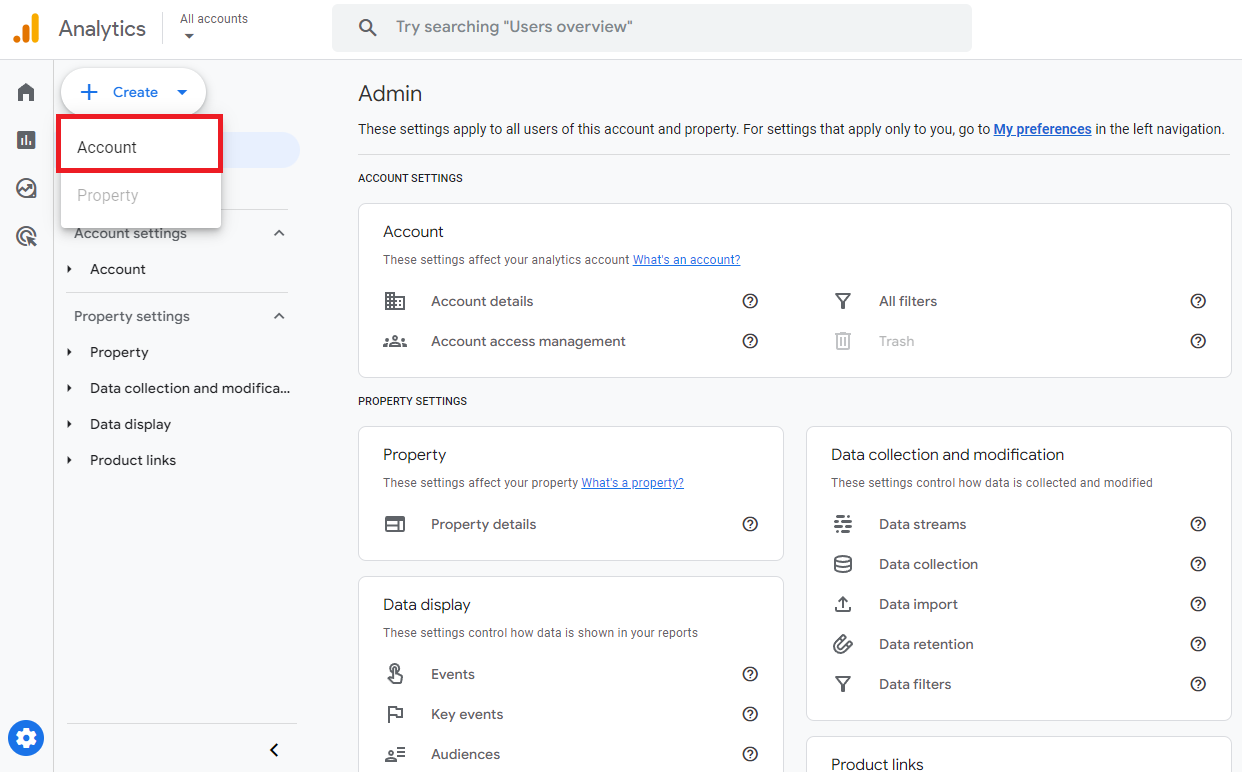
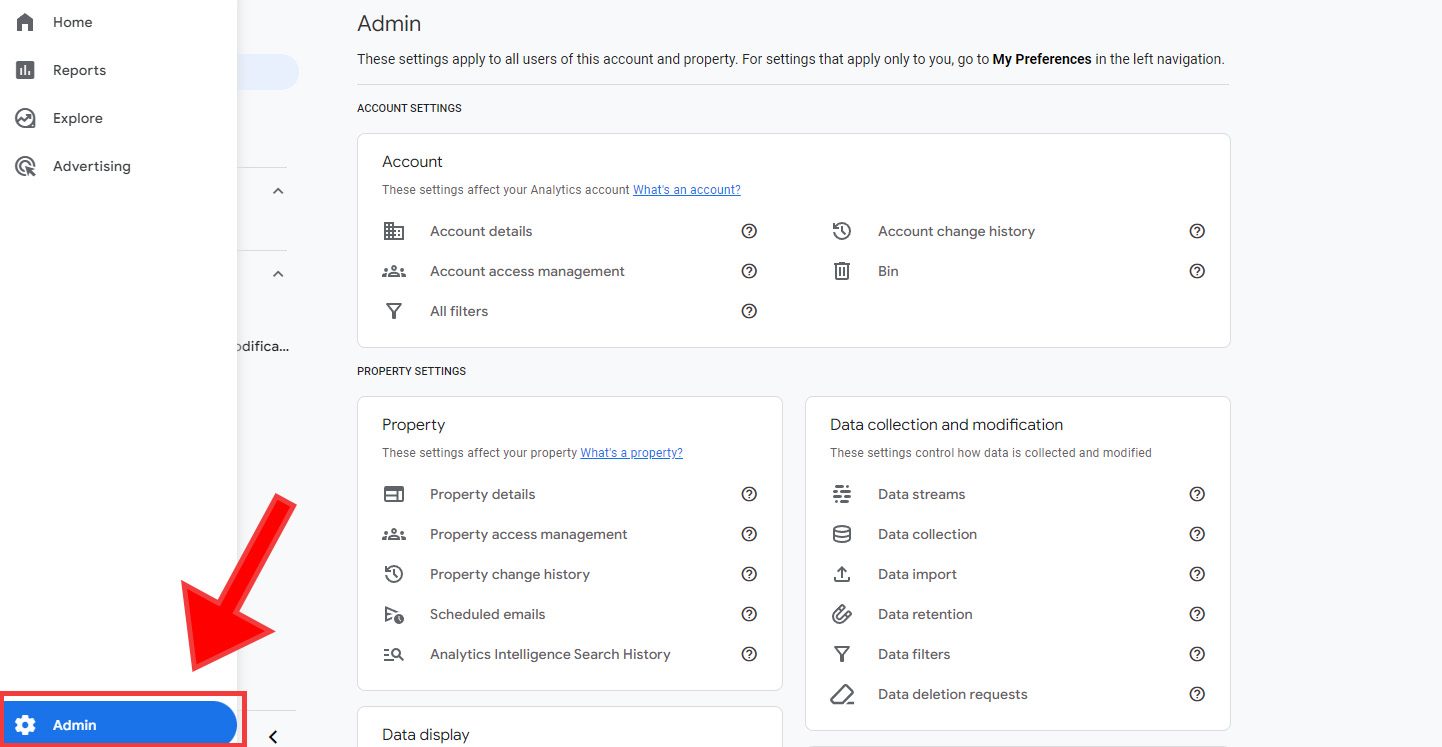
If you don’t already have a GA4 account, the first step is to create one. Once logged in, click on ‘Admin’ and then ‘Create Account.’ Follow the prompts to set up your new account. You’ll need to provide some basic information about your website or app, like its name and URL.
Tip: Be thorough with your account details. This information helps GA4 track your data accurately.
2. Configuring Data Streams
After setting up your account, the next step is to configure data streams. These are sources of data from your website, app, or other platforms.
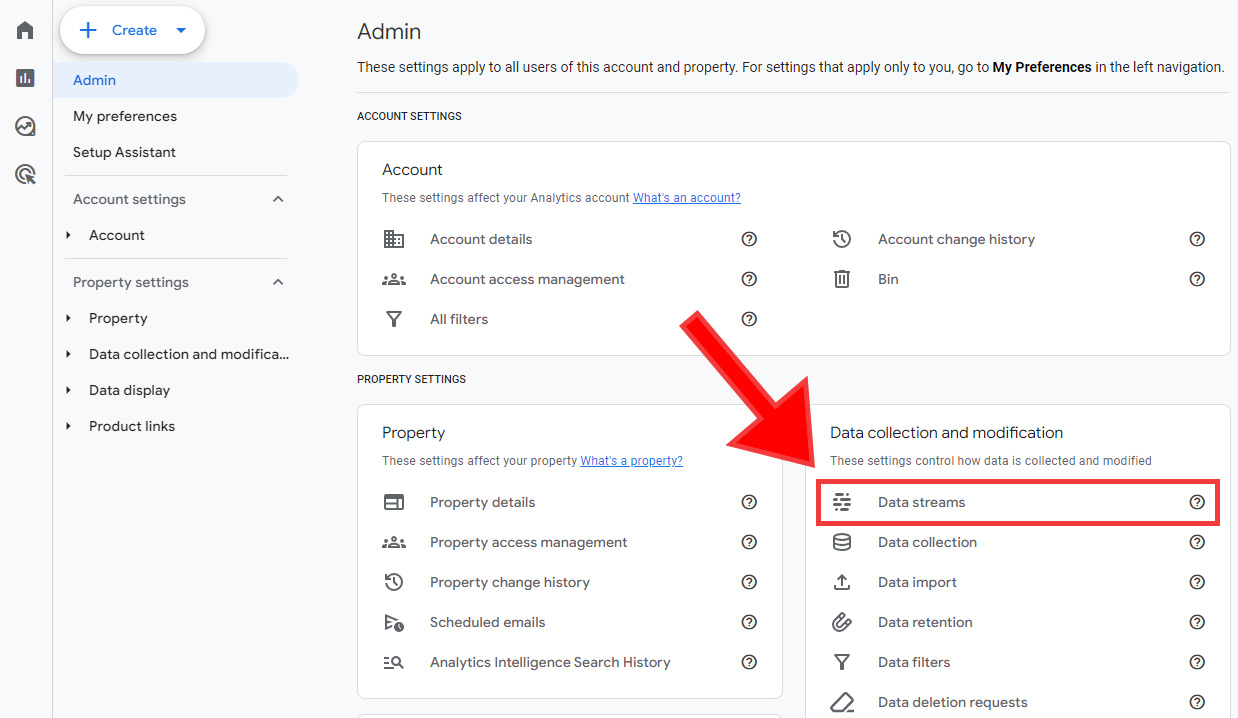
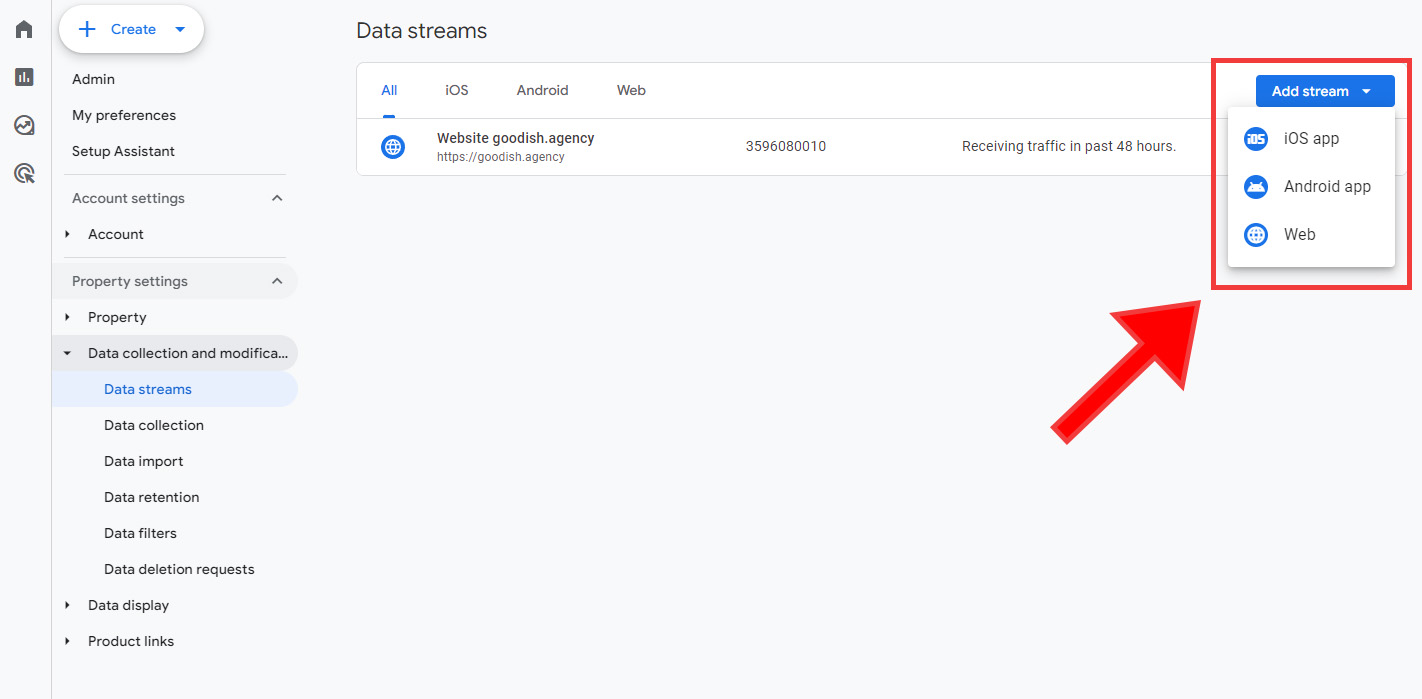
– In GA4, click on ‘Admin’ and then go to the ‘Data Streams’ section. Here, you can add a new data stream for your website or app. For a website, you’ll typically enter the website URL. For an app, you’ll need to use the Firebase platform.
– Once your data stream is set up, GA4 will provide a tracking code or ID. For websites, this code needs to be added to your site’s header.
Tip: Accurate data stream setup is crucial. It makes sure that GA4 collects the right data from your site or app.
3. Setting Up Goals and Events
Goals and events allow you to track specific user actions, like purchases, form submissions, or video views. This is key to understanding how users interact with your content.
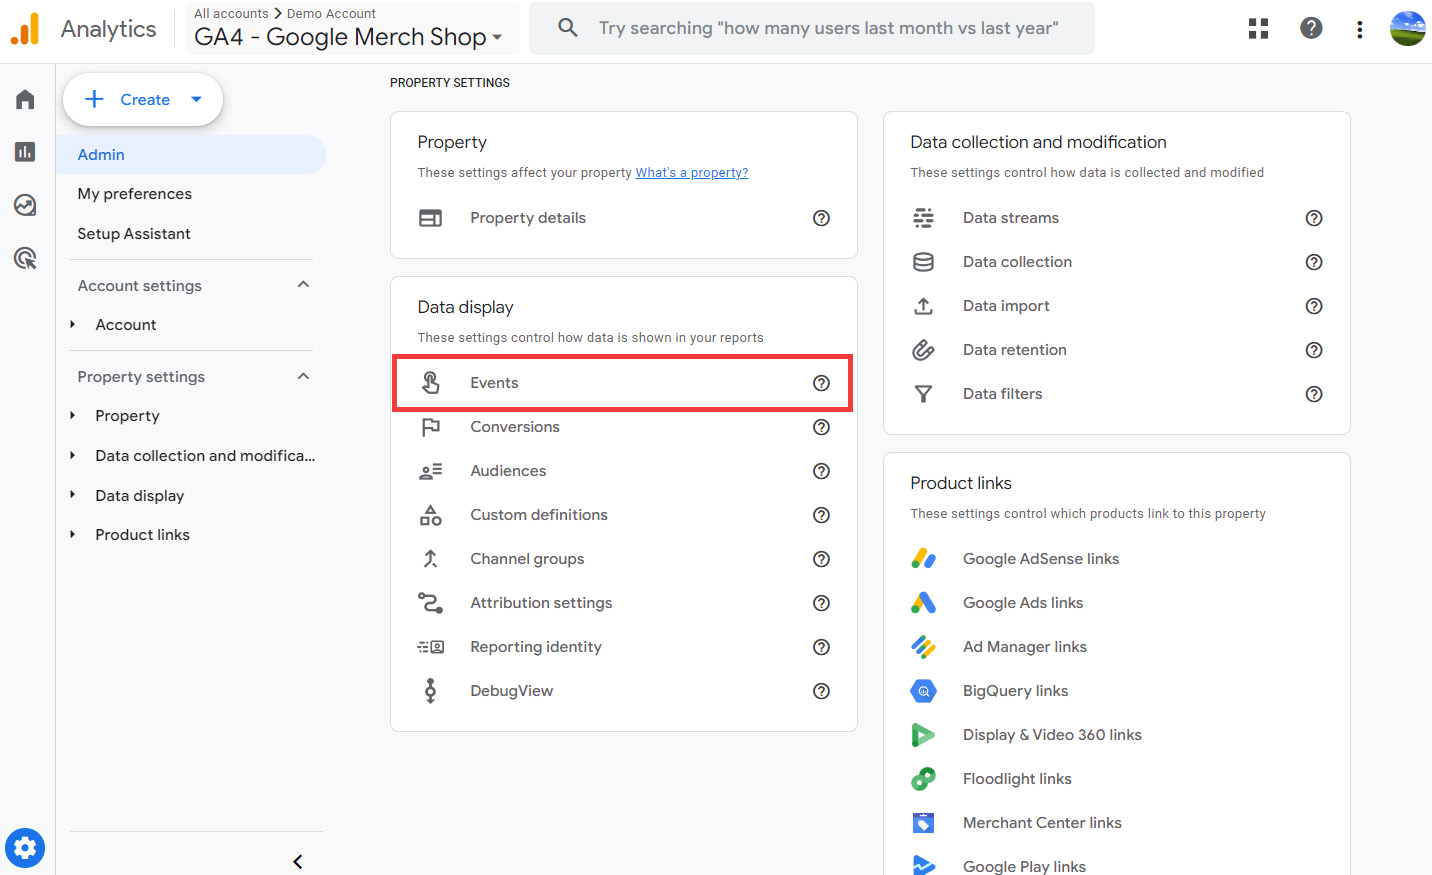
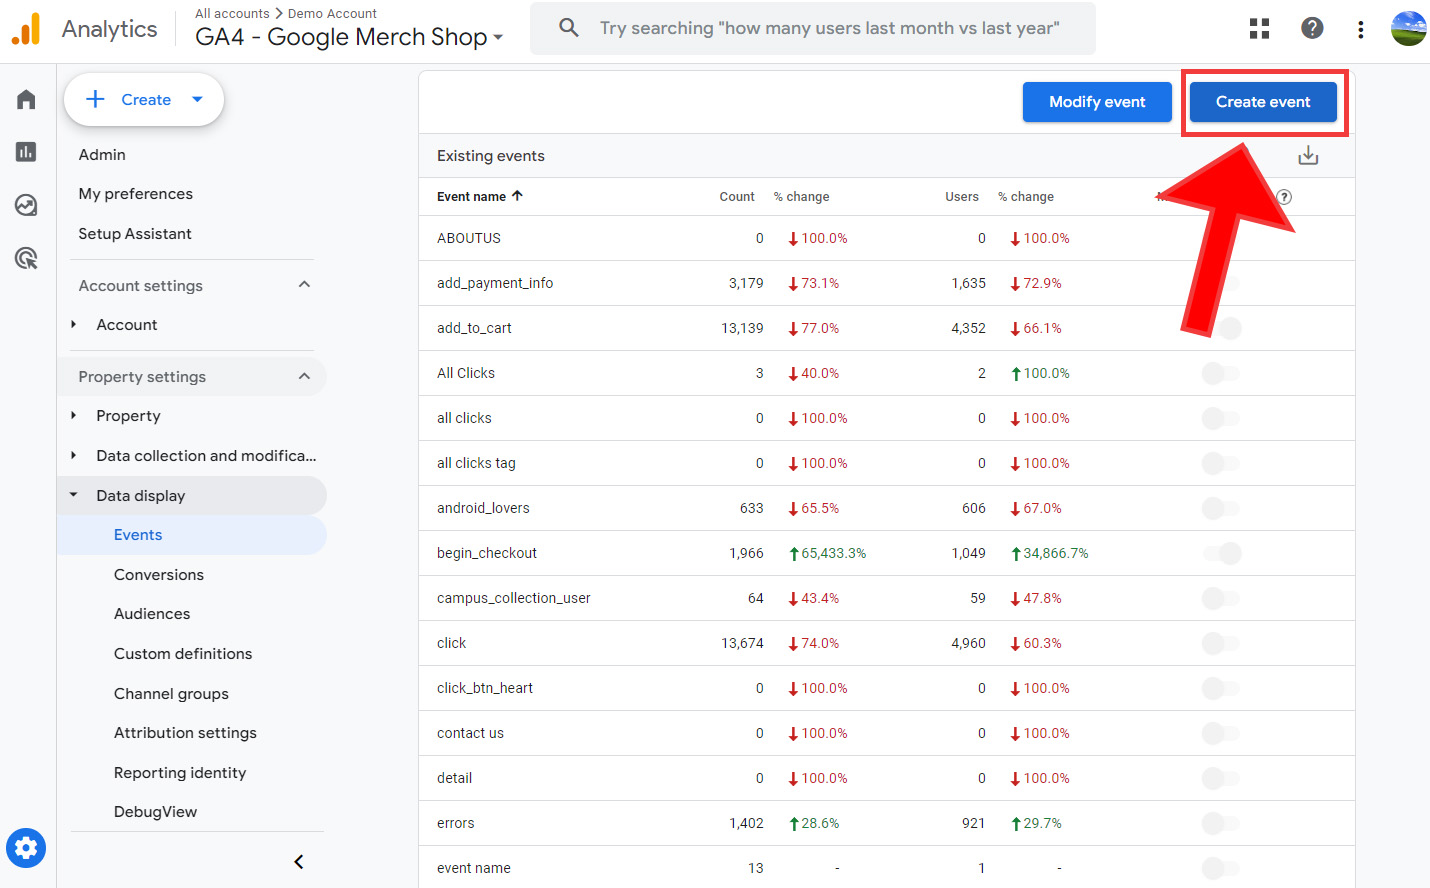
– In GA4, goals are set up as ‘events.’ To create an event, go to the ‘Events’ section in the ‘Configure’ area. Here, you can either use predefined events or create custom ones based on your specific needs.
– When setting up events, think about the key actions you want to track on your site or app. This could be anything from a user signing up for a newsletter to completing a purchase.
Tip: Regularly review and update your goals and events. As your website or app evolves, your tracking needs might change.
Unlock the Full Potential of Your Business With Google Analytics 4
We Help Businesses Migrate to GA4 With Ease
What can you expect from this call:
- Free GA4 Consultation
- Custom Plan Designed According To Your Business Goals
- Current Analytics Installation Audit


Key Metrics and Reports
Understanding the key metrics and how to interpret reports is essential for gaining insights into your website or app’s performance. Here, we’ll explore the most important metrics in GA4, guide you through accessing and interpreting standard reports, and discuss how to customize these reports to meet your specific business needs.
1. Important Metrics in GA4
User Engagement: This metric shows how users interact with your site or app. It includes data like time spent on a page, which pages they visit, and what actions they take.
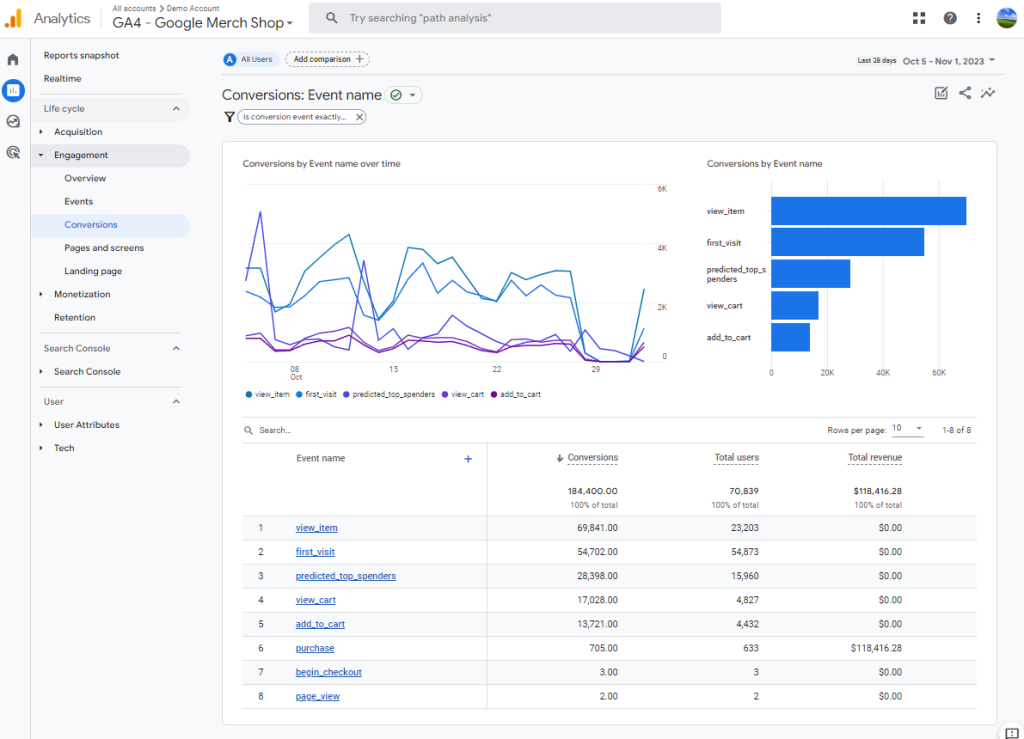
Conversions: Conversions are actions you want users to take, like making a purchase or signing up for a newsletter. GA4 lets you track these conversions to see how well your site meets your business goals.
Acquisition: This tells you where your users come from, whether it’s search engines, social media, or direct visits.
Retention: This metric shows how well you’re keeping your audience coming back. It’s important for understanding user loyalty.
2. Accessing and Interpreting Standard Reports
– You’ll find a variety of reports under the ‘Reports’ section on the left-hand menu. These include real-time reports, user acquisition reports, and user engagement reports.
– To interpret these reports, start by looking at the overview sections. They give you a quick snapshot of your site’s performance. For example, a high number of page views might indicate good content engagement.
– Look for trends over time. Are your user numbers growing? Is there a drop in engagement on certain days? These trends can guide your marketing and content strategies.
3. Customizing Reports
– You can customize reports to better suit your business needs. This means you can focus on the data that’s most relevant to you.
– To customize a report, go to the ‘Reports’ section and select a report. From there, you can add or remove data points, change the date range, and apply different filters.
– Custom reports are useful for deep dives into specific areas. For example, if you run an e-commerce site, you might create a report focusing solely on purchase behavior and conversion rates.
Advanced Analysis Techniques
GA4 also offers advanced analysis techniques that can provide richer insights. The ‘Explore’ section, custom reports, and the use of segments and cohorts are powerful tools in this regard. Let’s break down how you can use these features to get a more detailed understanding of your audience and their behavior.
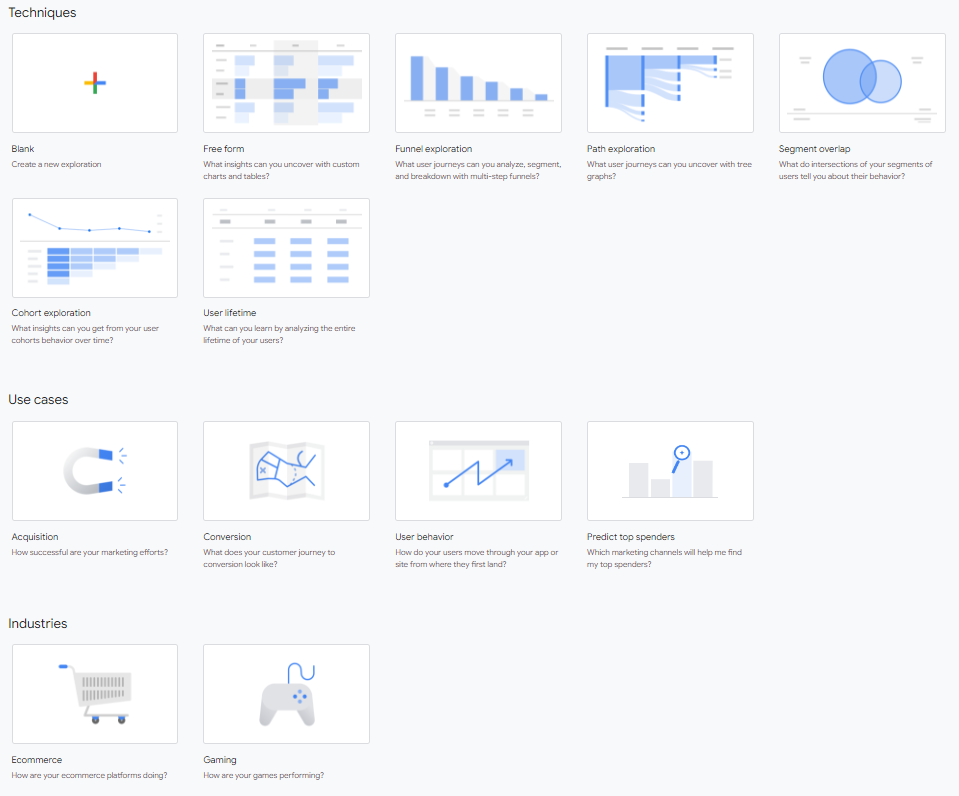
1. Exploring the ‘Explore’ Section
– The ‘Explore’ section is where you can conduct in-depth analysis. It’s like a laboratory for your data, where you can mix and match different metrics and dimensions to uncover new insights.
– To get started, go to the ‘Explore’ section. Here, you’ll find different templates, like blank explorations, funnel analysis, and path analysis. These templates are starting points for your custom analysis.
Tip: Start with a simple exploration, like comparing user behavior across different channels (like social media vs. direct traffic). This can reveal where your most engaged users are coming from.
2. Creating Custom Reports and Funnels
– Custom reports let you focus on the specific data that matters to your business. You can create these reports to track unique metrics or combinations of data that aren’t available in standard reports.
– For example, you might create a custom report to track user behavior on a new product page or a marketing campaign.
– Funnels are another powerful tool. They let you see the steps users take towards a conversion, like purchasing a product. This helps you identify where users drop off and what steps are most effective in driving conversions.
Tip: Use funnels to test different user paths. For instance, see if users are more likely to make a purchase after reading a blog post or watching a video.
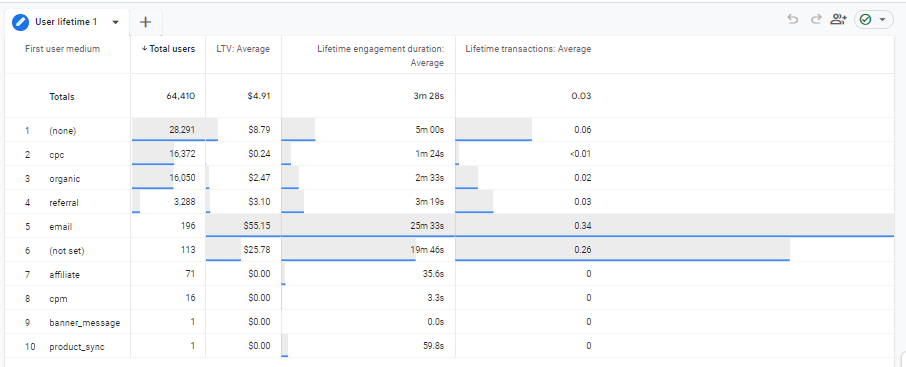
3. Using Segments and Cohorts for In-Depth Analysis
– Segments allow you to isolate and analyze specific groups of users. For example, you might create a segment for users who visit your site from a particular country or use a specific type of device.
– Cohorts are groups of users who share a common characteristic over a specific time period. For instance, you might analyze a cohort of users who made their first purchase in a particular month.
– Both segments and cohorts can be used to perform more granular analysis. For example, you might compare the behavior of new users versus returning users.
Tip: Experiment with different segments and cohorts to understand how various user groups interact with your site or app. This can help tailor your marketing and content strategies to different audiences.
Integration with Other Tools
Integrating Google Analytics 4 with other tools, both from Google and third parties, can significantly improve your data analysis capabilities. This integration allows for a better understanding of your audience and the effectiveness of your marketing strategies. Let’s explore how you can connect with other tools and the benefits of these integrations.
1. Integrating GA4 with Google Tools
Google Ads: Linking GA4 with Google Ads is a powerful combination. It allows you to see how your ads are performing in terms of driving traffic and conversions on your site. You can track which ads are most effective and adjust your advertising strategy accordingly.
Google Search Console: Integrating it with Google Search Console provides insights into how your site performs in search results. You can see which search queries bring users to your site and how these users behave once they arrive. This information is invaluable for optimizing your SEO strategies.
Google Tag Manager: Using GA4 with Google Tag Manager simplifies the process of tracking events on your site. It allows you to manage and deploy marketing tags (snippets of code or tracking pixels) on your website without having to modify the code.
Tip: Regularly check the data from these integrations to get a complete picture of your online presence and user behavior.
2. Integrating Third-Party Tools
– GA4 can also be integrated with various third-party tools to enhance your data analysis. These tools can provide additional insights into customer behavior, e-commerce tracking, social media performance, and more.
– For example, integrating e-commerce platforms like Shopify or WooCommerce with GA4 can give you a clearer picture of your online sales and customer journey.
– Social media tools can also be integrated to track how social media campaigns contribute to website traffic and conversions.
Tip: When integrating third-party tools, ensure that the data is syncing correctly with GA4. Regularly monitor and validate the data to maintain accuracy.
Predictive Analysis
GA4 offers predictive metrics that can forecast future user behavior. This feature is incredibly useful for strategic planning and making informed decisions about your marketing efforts. Let’s take a look at what these predictive metrics are and how you can use them for your business.
1. Understanding Predictive Metrics
– Predictive metrics in GA4 use machine learning to estimate future actions of your users. For example, “Purchase Probability” predicts the likelihood that users who have visited your site will make a purchase in the next 7 days.
– Another predictive metric is “Churn Probability”, which estimates how likely it is that active users will not visit your site in the next 7 days.
– “Revenue Prediction” is another useful metric, especially for e-commerce sites. It predicts the future revenue from a particular user in the next 28 days based on their past behavior.
Tip: To make the most of these metrics, ensure you have enough data. The accuracy of predictions improves with more data.
2. Using Predictive Metrics for Forecasting and Planning
– These predictive metrics can be a game-changer for your business strategy. For instance, you can use “Purchase Probability” to identify potential customers and target them with specific marketing campaigns or special offers.
– “Churn Probability” helps in retaining users. If you know a user is likely to stop visiting, you can take proactive steps like sending them re-engagement emails or personalized offers.
– Use “Revenue Prediction” to forecast sales and plan your inventory or marketing budgets accordingly. This can be particularly helpful in managing resources and maximizing profits.
Tip: Combine predictive metrics with other GA4 features like audience segmentation. This allows you to create targeted groups based on their predicted behavior and tailor your strategies to these segments.
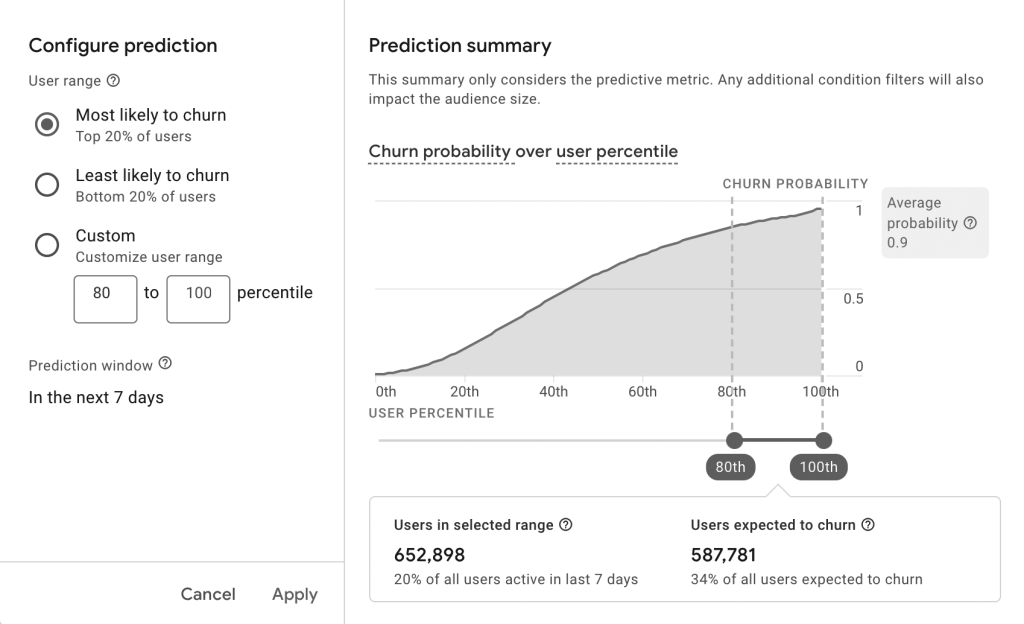
Source: Google
Common Challenges and Solutions in GA4
Starting with GA4 can come with its set of challenges. Users often encounter issues like data discrepancies, navigation difficulties, and understanding the new reporting structure. Let’s discuss some of these common challenges and offer practical solutions and best practices to overcome them.
1. Data Discrepancies
Challenge: A frequent issue users face is discrepancies in data when comparing GA4 with Universal Analytics or other analytics tools. This can be confusing and may lead to questioning the reliability of the data.
Solution: It’s important to understand that GA4 uses a different measurement model (event-based) compared to Universal Analytics (session-based). This means data won’t always match up directly. To mitigate this, ensure that you’ve correctly set up all events and parameters in GA4. Also, use GA4’s data for trend analysis rather than absolute numbers.
Best Practice: Regularly check and validate your data setup. Over time, as you become more familiar with GA4’s model, discrepancies will become less alarming.
2. Navigation Issues
Challenge: New users often find navigating GA4’s interface challenging, especially if they are accustomed to Universal Analytics. Finding specific reports or settings can be difficult.
Solution: Spend time exploring the GA4 interface. Start with the basic features and gradually look into more complex areas. Use Google’s resources and tutorials, which provide step-by-step guidance.
Best Practice: Regular use and exploration are key. The more you use GA4, the more intuitive it becomes. Also, consider customizing your dashboard with reports you frequently use for easier access.
3. Understanding New Reporting Structure
Challenge: GA4’s reporting structure, centered around events and user properties, is a significant shift from the session-based model of Universal Analytics. This change can be hard to grasp initially.
Solution: Take time to learn about the event-based model. Experiment with creating and tracking different events relevant to your site or app. Use the ‘Explore’ section to see how different events interact and affect user behavior.
Best Practice: Start with tracking basic events and then gradually add more complex ones. Use GA4’s built-in events as a guide and customize them to fit your specific needs.
4. Setting Up Conversion Events
Challenge: In GA4, goals from Universal Analytics are replaced with conversion events, which can be tricky to set up correctly.
Solution: Identify the key actions you want to track as conversions (e.g., purchases, sign-ups). Use GA4’s event modification feature to mark these events as conversions.
Best Practice: Regularly review and update your conversion events to ensure they align with your current business objectives and website/app functionalities.
Conclusion
As we conclude our guide, let’s quickly recap the main points. GA4 gives a detailed and user-focused view of how people interact with your website or app. We’ve covered how to set up GA4, how to use its main features, and how to read and understand the data it provides. We also looked at advanced options like making your own reports, predicting future trends, and combining GA4 with other tools for a complete digital analysis.
Now, it’s your turn to experiment with GA4. Play around with its features, customize your reports, and see how its advanced analytics can benefit your specific needs. Remember, the more you use GA4, the more familiar and intuitive it will become.
If you’re finding GA4 challenging or have specific needs, remember that we’re here to help. Feel free to contact us for assistance.
We at Goodish agency are experts in digital marketing and we can help you to utilize AI to reduce your costs and boost your performance. Read more about our services.
Unlock the Full Potential of Your Business With Google Analytics 4
We Help Businesses Migrate to GA4 With Ease
What can you expect from this call:
- Free GA4 Consultation
- Custom Plan Designed According To Your Business Goals
- Current Analytics Installation Audit