Let’s talk about Google Analytics, one of the most useful tools out there for any SaaS company. If you were wondering what is Google Analytics and how to set up a Google Analytics Account, you’re in the right place. This Google Analytics tutorial will point out the most common missed opportunities we usually see amongst the clients of Goodish Digital Marketing Agency. We’ll proceed with looking at how to use Google Analytics; here we’ll discuss basic report insights as well as how to utilize secondary dimensions and segments. And finally, we will look at some top Google Analytics reports that we use for our clients.
This article addresses both Google Analytics beginners and those who are already more advanced but want to refresh their knowledge of all the different features that a google analytics dashboard offers.
GOOGLE ANALYTICS BASICS
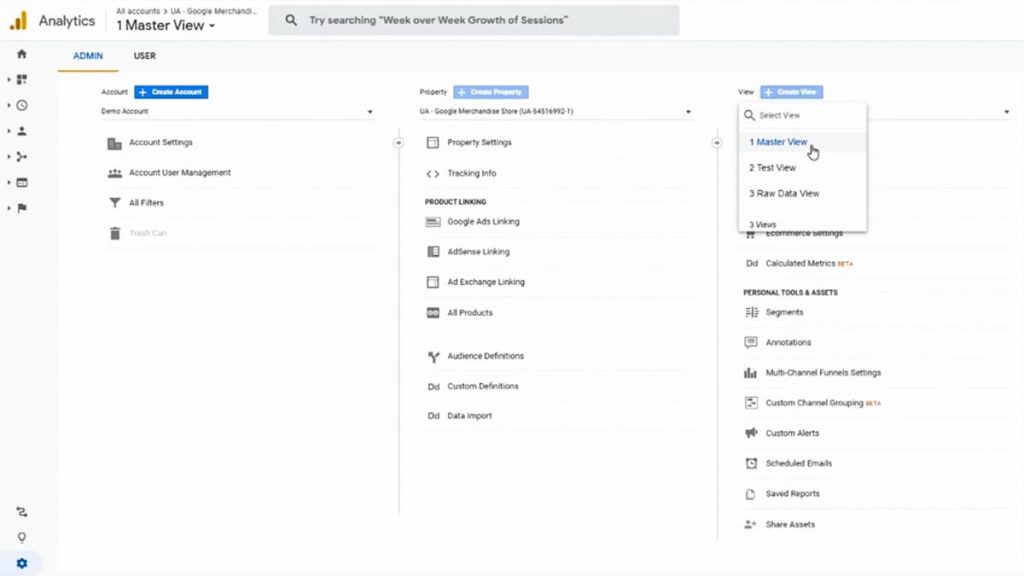
The first mistake we often see with our clients is inappropriate account structure. Google Analytics dashboard has a nice structure; once on the main view, you see your account on the left-hand side (we recommend having one account for one business). The middle column refers to a property, which is a page on the website level (ie. a shop, a blog, info page; each site should be a different property). Finally, each property should have at least views:
- Main View – also known as everyday Working View for everyday usage
- Test View – great for applying filters which can then be transferred to the Main View after a couple of days of testing
- Raw Data View – also known as Backup View – deleting data from your Google Analytics will make irreversible changes so this is where your backup will be stored
Add User to Google Analytics
You can add users to only one or all three levels of your Google Analytics account depending on your company’s needs. We would recommend giving admin access “Manage Users” to 2 – 3 people only while the rest of the people connected to your Google Analytics account can be simply given the permission to Edit, Collaborate, and/or Read & Analyse. How much access you should give someone should depend on their work (ie. someone doing an analysis of your site will have enough access with a Collaborate and Read & Analyse).
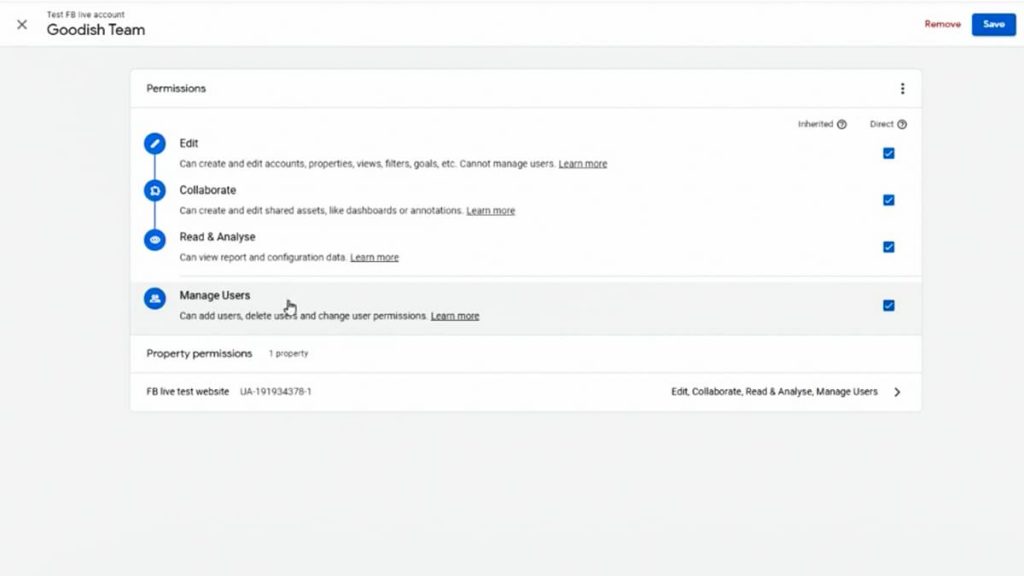
When setting up your Google Analytics, give "Manage Users" access only to the people who are essential to your business and provide minimum access to other users based on their needs to protect your account going forward. Revise this regularly.
Tools to Integrate into Your GA Account
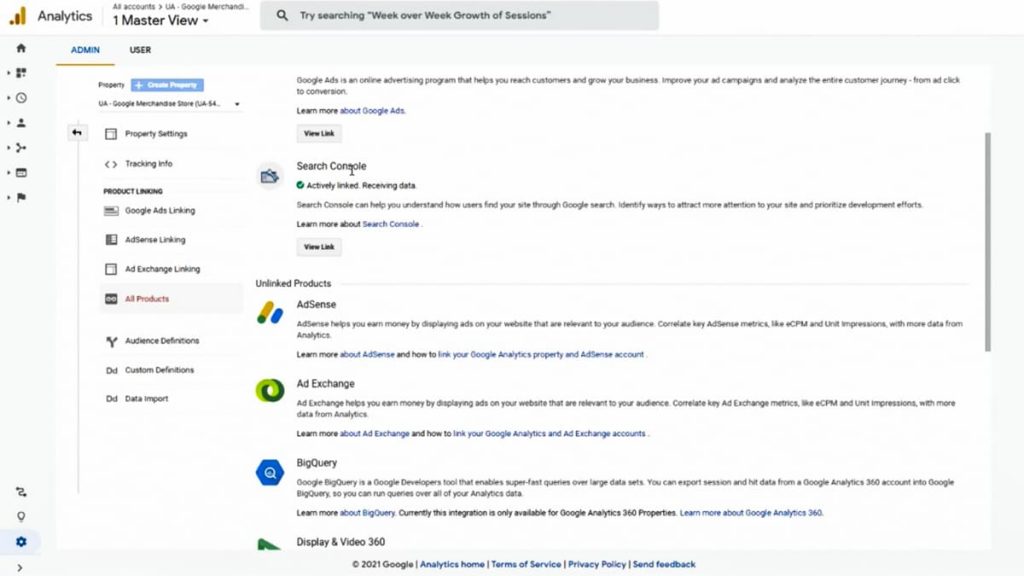
Google Analytics can also integrate with certain products that will make your tracking much easier to view. We would strongly recommend integrating Google Ads and Google Search Console into your Google Analytics account. This can be done at the Property level.
Google Search Console is a Google product that helps you to measure and observe SEO (ie. organic searches, which keywords are you ranking for, which landing pages are ranking for certain keywords etc). Hence, by linking Google Analytics and Google Search Console, you will get this data into your Google Analytics account.
You should also consider adding Google Tag Manager which provides the user with the ability to add and update tags used for site analytics, remarketing, conversion tracking, and more. You can learn more about Google Tag Manager by reading our article but for now, we simply want to provide you with the basics. Installing Google Analytics via Google Tag Manager is relatively a straightforward process. So if if you have WordPress or a similar website, you can simply use a plugin or add a Google Analytics Tag in Google Tag Manager which you then insert into your website.
Your Google Tag Manager will want to contain a Google Analytics Tag, as well as your Facebook pixel and any other tags that you’re using. Once in your G Tag Manager click on New Tag, and add your GA tag by tracking Page Views, add your GA code under Google Analytics Settings and you’ll want All Pages to be selected under Triggering.
Alternatively, simply use a Google Tag Manager Agency who will be able to not only integrate your tools but also optimize them to follow your sales funnel seamlessly.
AUDIENCES IN GOOGLE ANALYTICS
You should define different audiences based on how users are engaging with your website. For example, you can put all of your website visitors from the past 7, 30, 60, or even 120 days, last 30 days into one audience. Then, you can import this audience into Google Ads, and re-market to them directly or simply create a similar audience in Google Ads.
Creating audiences it’s quite simple and we would recommend creating many. Besides creating audiences based on your past visitors, we also recommend creating audiences based on how your users are interacting with your website. Consider different segments based on the user activity – ie. people who added to cart people, who read blogs, people who watched a video, people who stayed on your website for at least 60 seconds, etc. Then, get creative. For example, when you’re creating remarketing in Google Ads, you can remarket just those who visited and stayed on your blog for 60 seconds but didn’t become a lead.
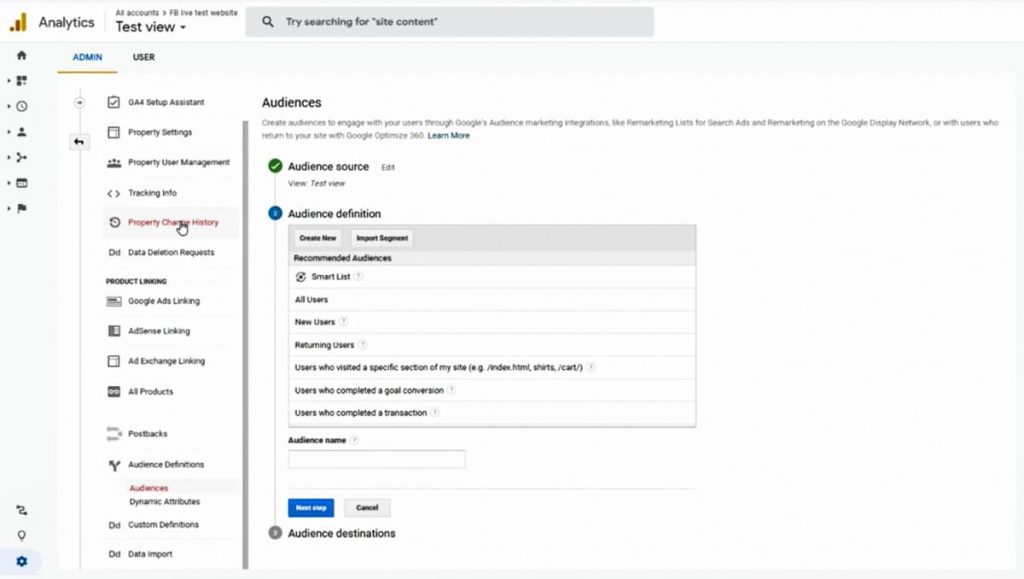
Even though Google has the data of your website visitors you won’t be able to access it unless you’ve created the audience ahead of time.
The important thing to remember about audiences in Google Analytics is that they will be generated based on your past data, meaning it will take 7 or more days to generate an audience, so set them up ahead of time.
It’s hard to predict which audiences you’ll need so it’s a good idea to create many. This will give you the ability to combine those audiences for either re-marketing or creating a lookalike audience for campaigns. Usually, at our Google Analytics agency, we tend to create 20 to 30 audiences based on various activities of the website users.
FILTERS iN GOOGLE ANALYTICS
A common mistake we see when creating the Google Analytics account is not using filters. Filters enable you to exclude certain IPs so you want to start with excluding your IP address, your colleagues, and any bots that you notice coming to your site. You can do so by simply googling your IP address and pasting it into the filter.
By removing these IPs and bots you’ll also remove the unnecessary tracking of ghost conversions which would provide you with a false indication of how your site is performing.
Looking at reports, Google Analytics really shines when measuring things important to your business. While those standard metrics like bounce rate or average session duration will give you some indication of how your site is performing, it’s not providing you with the whole picture. Every website has specific goals – from purchases to reading a blog, downloading a PDF, or signing up. These micro-conversions are called Google Analytics events. We would urge you to use Google Tag Manager for tracking your site as it makes tracking these little events very easy and straightforward.
Recently, Google came up with a new version, Google Analytics 4 (or GA 4), which is now officially out of beta. This latest version of Google Analytics is not URL-based anymore; it’s event-based instead making Google Tag Manager more relevant than ever before.
This ability to track little events also gives real power to Google Analytics, as you’ll be able to segment your traffic based on those events. So you can compare people who ie. stayed on the website for 60 seconds versus people who read your blog, versus those who scrolled to the end of the landing page.
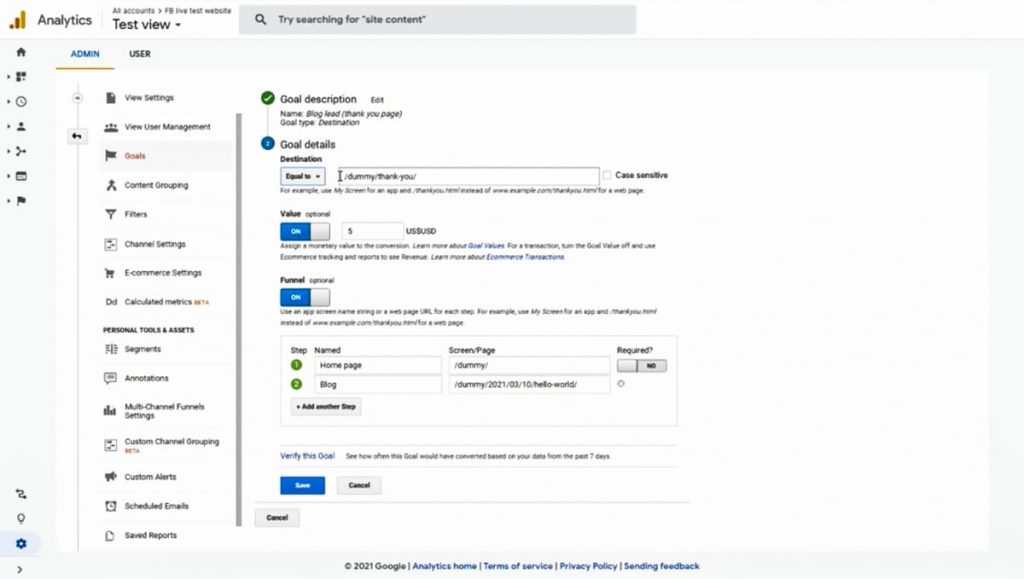
When setting up a new goal, you have four options:
- Destination
- Duration
- Pages/Screens per session
- Event
We would especially highlight Destination and Event as the two most popular options which will provide you interesting insights.
The “Destination” is based on the URL. So when setting up a new goal based on a URL you can, for instance, make the “/thank-you/” page a goal that you want to track and add Events to track the customer’s entire journey. In our example, we added Home Page and the Blog Page Events to the funnel. You can also apply value to your goal.
Once we’ve set up the conversion, we can go to the Real-time Reports —> Conversions to see how this conversion was tracked. We recommend using this on the Test View level first so you can see if everything is set up correctly or if any debugging is needed.
The next mistake we often see is people don’t unlock the Audience —> Demographics. You can enable this by clicking Enable button under Demographics. Once you’ve done so, go under Interest and Overview and view your segments.
To summarise, when creating our Google Analytics account, we recommend spending some time in the Admin section and thinking about how to structure your account:
- Determine the Property, Account, and View. Make sure to create a Test View and Backup View, so you have a place to test new ideas, and a backup in case something goes wrong.
- Make sure that you connect Google Ads and Google Search Console.
- Create filters, filter out your internal traffic and bots.
- And most importantly, make sure that you track all the little events. Every button click, scroll depth, conversion, downloads, etc. This will enable you to collect real insights about how the user is moving around your website, what people are clicking on, what are they reading, etc.
GOOGLE ANALYTICS REPORTS
On the left-hand side of your Google Analytics dashboard you’ll see a funnel structure with different points of events – Real Time, Audience, Acquisition, Behaviour and finally Conversions. Reports are well structured, highlighting the number of Users, Bounce Rate, Average Session Duration, Transactions, Revenue, etc. You can also compare the current period to the previous one and track your growth through time.
A couple of features we tend to highlight at our Google Analytics agency are Secondary Dimensions and Filters. By going into Acquisition —> All Traffic —> Source/Medium you’ll be able to see where your traffic is coming from – Direct traffic, Google Ads, SEO/Organic Traffic, Affiliate links, Referrals, Emails etc. Now, under the “Secondary dimension” we can add ie. “Landing Page”, “Campaign Name”, “City” etc.) so we can break the data further and get deeper into our report. Let’s add a filter of Google/organic and see which landing pages are performing best organically.
The second way of achieving this report/view is using Segments above the graph. Again, the more Audiences you’ve added the bigger your possibilities are when creating your reports. Once you’ve added them you can study your users’ behavior under Segments in Reports. You can filter the segments depending on what we would like insights on, ie. returning versus new users, or organic versus paid traffic, those who read your blog versus those who didn’t, those who added to cart versus those who didn’t etc.
Learn more about how Google Analytics Reports are structured and their various features.
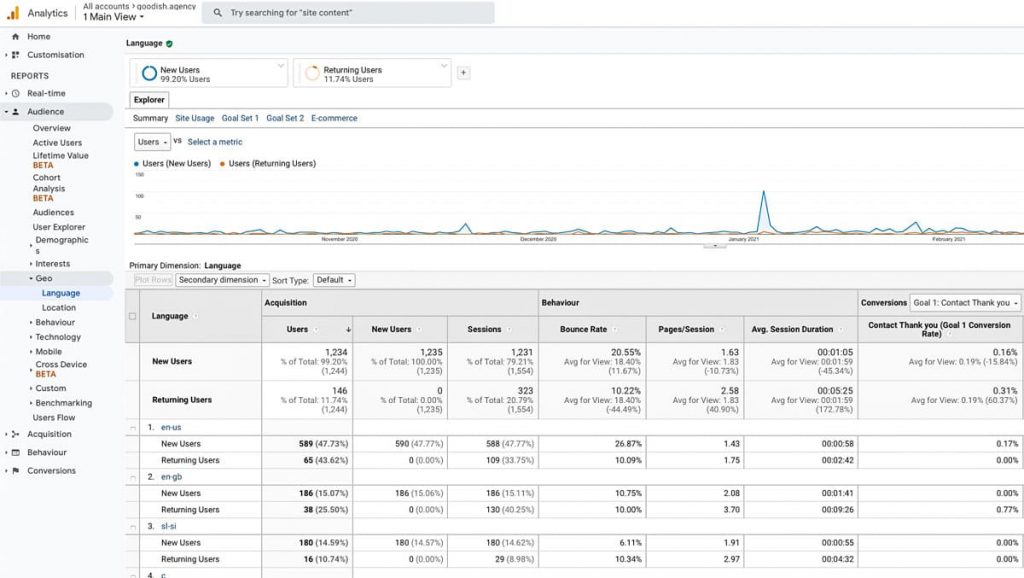
For example, let’s say you have visitors coming world-wide and you’d like to understand in which languages you should try to strengthen your brand, you can turn on the segments New Users & Returning Users. Then go under Audience —> Geo —> Language. So now you’ll be able to see how New and Retuning Users are behaving on your site depending on their chosen Language so you can see if certain languages on your site need optimizing. Do keep in mind that it’s common that Returning Users perform better than your New Users.
Most Useful Google Analytics Reports
Let’s have a look at the reports that we, as a Google Analytics Agency enjoy using and would recommend to our clients.
1. Audience —> Technology —> Browser & OS
This technical report tells you is how your website is performing on different browsers. So here what you could do is add Mobile Users & Desktop Users under Segments or as a Secondary Dimension. We’ll do the latter by adding “Device Category” under “Secondary Dimension”. By clicking on “Advanced” we can filter the users to only Mobile Users.
This can indicate which mobile browser is performing the worst, meaning your site might not be fully optimised for that mobile browser. For instance, you could have a pop-up that cannot be closed on a certain mobile browser and we can quickly fix this based on this Google Analytics Report.
When using Google Analytics, never make quick judgments based on a small sample of users, rather extend the period duration so you can have a clearer picture.
2. Acquisition —> All Traffic —> Source/Medium
At Goodish Google Analytics Agency we quite like using this report as it provides a clear picture of the different traffic sources. It also enables the user to add a secondary dimension such as a Location, Landing page, etc. Combining the original Source/Medium with these secondary metrics can be really powerful.
3. Acquisition —> Search Console—> Queries
This is where you can see what search queries you are ranking for which is great for tracking your SEO goals.
4. Behaviour —> Site Content—> All Pages
This report shows the performance of the different pages on your site and is especially relevant if you’re creating various content ie. podcasts, blogs, videos, PDFs. You can then compare those pages here. If you’d like you can add a filter and take a look at only your blog pieces, or different product pages. Similar to Landing Pages and Exit Pages, you’ll be able to see which pages attract most of your website visitors and which pages are making people drop off your website.
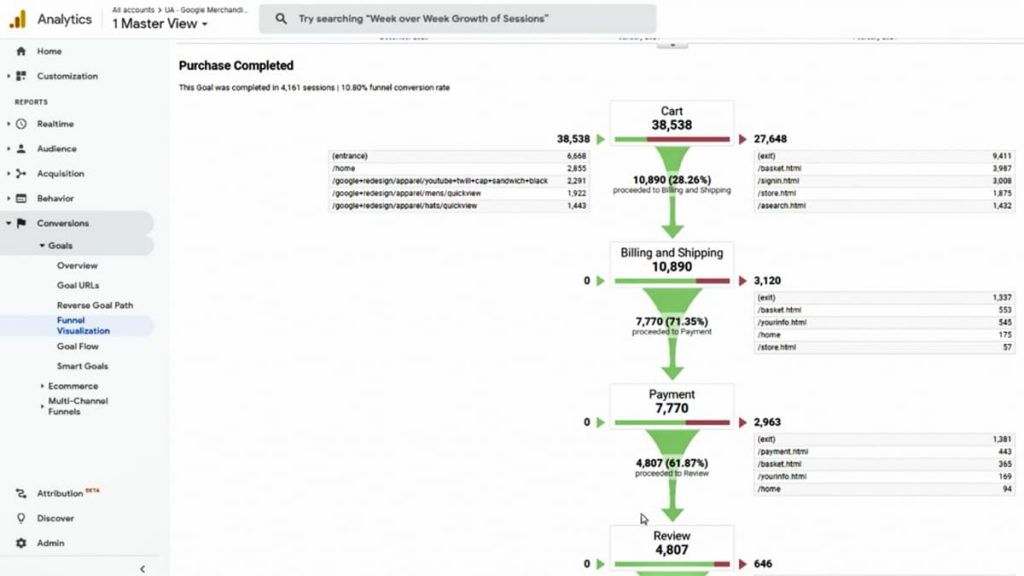
5. Conversions —> Goals —> Funnel Visualization
This refers back to the Goal Setup we did when setting up a Google Analytics account. So once you’ve added your Goals and Funnels to your Goals, you’ll be able to see a clear funnel under this section (keep in mind it will take a few days to generate the data). So if you have an e-commerce website you can have a clear funnel from Add to Cart —> Billing & Shipping —> Payment —> Review —> Purchase Completed.
These reports offer great visualization, making them easy to understand.
Google Analytics dashboard also has a section for E-commerce. If that’s the case for your brand it’s another section we would recommend having a deeper look into (Conversions —> Ecommerce).
6. Conversions —> Multi-Channel, Funnels —> Model Comparison Tool
And the last report we would like to show you is the Model Comparison Tool, which is an advanced report that not many people fully understand. Here, you’ll first see what your direct traffic sources are. Now what you can do is compare Last Interaction with First Interaction and you can see really which medium is bringing you the most conversions. You can for instance see in our example that if we would attribute all conversion values from the first user page visits to paid search, this will increase the value of paid search by 22%. Meaning, this channel is important for you in the early stage of the user journey.
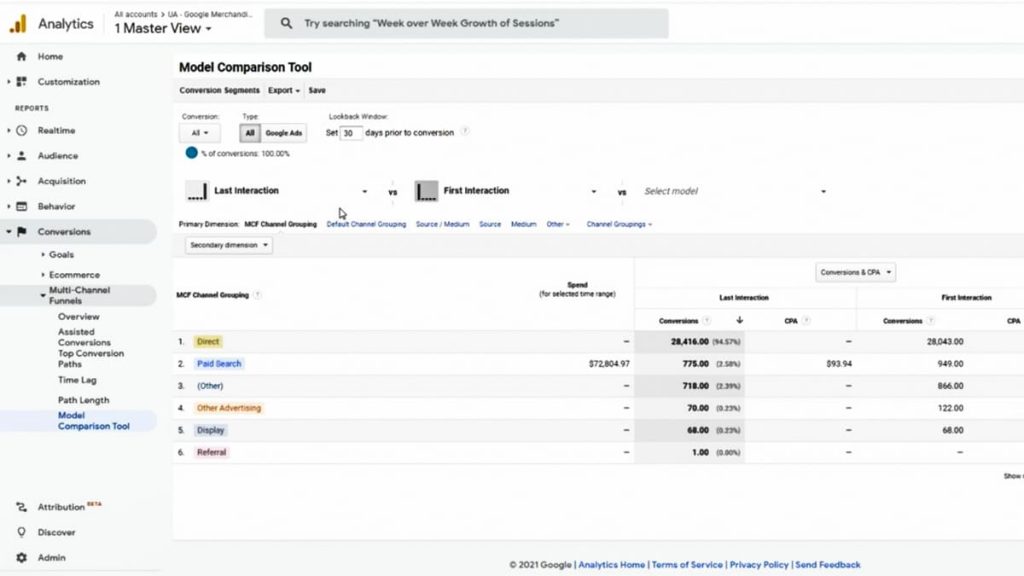
Most of the reports we looked at before were all focused at the bottom or at the beginning of the funnel, and the conversions were attributed to the last source medium. As this doesn’t provide you with the whole picture we’d recommend taking into account the First Interaction as it will give you a clearer picture of your whole funnel.
We hope you found these tips useful and now understand the basics of how to use Google Analytics. Google also offers a Google Analytics certification that we’d recommend checking out if you’d like to gain more knowledge on the topic. If you’d like some help analyzing your sales funnel and you’re looking for a Google Analytics agency, don’t hesitate to get in touch!