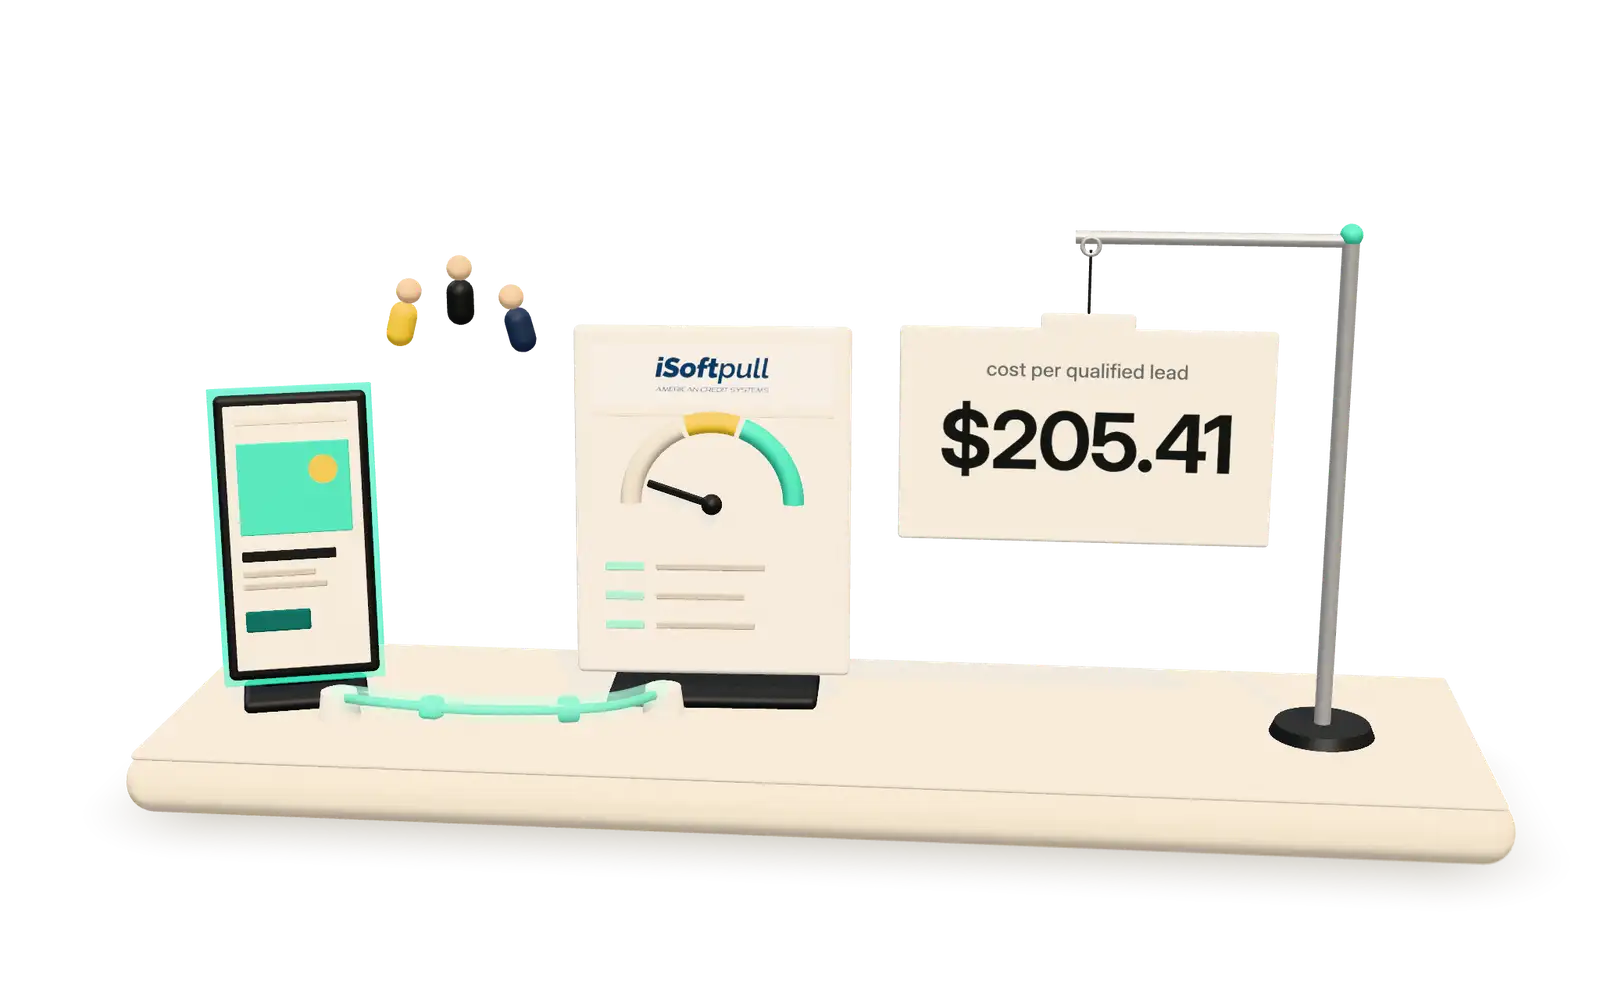
A good cost per lead is the highest price your close rate and deal value can pay for, not a number from an industry table. Among our own clients, cost per lead has ranged from $2,140 (TMT Finance, before we fixed their funnel) to $25.84 per qualified lead (iSoftpull, in early 2026). Both numbers are real, and neither is a benchmark for you: work out your own ceiling from what a customer is worth, how many leads become customers, and how much of that value you are willing to spend to win one.
We are Goodish, a senior team in Novo mesto and Maribor, Slovenia, and most of our clients are US companies in fintech, SaaS and franchising.
Why is there no single benchmark for B2B cost per lead?
Because “a lead” means something different in almost every account. A published average blends a whitepaper download with a booked demo, a $50-a-month tool with a credit-data API sold to lenders, and a search click from someone ready to buy with a social click from someone who was curious. The average of those is not a target for any of them.
Four things move cost per lead more than anything else:
| Factor | Pushes cost per lead up | Pushes cost per lead down |
|---|---|---|
| Deal size | Large contracts, few buyers, long sales cycles | Self-serve plans, many buyers |
| Qualification | Leads counted only after they meet sales criteria | Every form fill counted as a lead |
| Channel | High-intent search terms, competitive auctions | Broad social audiences, retargeting |
| Category rules | Lending, credit and other restricted categories with verification and policy limits | Unrestricted products with open targeting |
So when someone asks us whether a number is good, the first questions are always: good for what deal size, counted at which stage, from which channel?
What do our clients actually pay per lead?
These are our clients’ numbers, from our engagement reports. They show what changed when the measurement changed, not what you should expect to pay.
| Client | What counts as a lead | Before | After | Period |
|---|---|---|---|---|
| iSoftpull, US B2B credit-data software | Qualified lead | $205.41 | $25.84 (−87%) | Late 2024 → early 2026 |
| TMT Finance, UK financial media and funding | Lead (conversion in the application flow) | $2,140 | $48.74 (−97%) | Late 2023 → early 2026 |
Two details matter more than the percentages.
First, the iSoftpull figure is per qualified lead, and volume grew while the price fell: 88 qualified leads in January. A low cost per lead with no volume behind it is not a result.
Second, TMT Finance’s $2,140 was not an advertising problem in the usual sense. $4,200 of spend had produced two conversions because people were dropping out of the application flow. We integrated product analytics, found the confusing fields and friction points, redesigned the onboarding flow, and only then relaunched Google Ads with Smart Bidding fed by the new conversion data. January alone produced 155 conversions, where the old funnel had managed two a month.
How do you calculate the cost per lead you can afford?
Start from the customer and work backwards. The formula we use:
Maximum cost per lead = customer value × lead-to-customer rate × acquisition share
- Customer value is the gross profit a new customer brings over the period you are willing to wait for payback. For a SaaS product that is often first-year gross margin; for a lender or a broker, the margin on the first funded deal plus any repeat business you can rely on.
- Lead-to-customer rate is the share of leads that become paying customers, taken from your CRM, measured per channel, and measured over at least one full sales cycle so that late closers are counted.
- Acquisition share is the part of that customer value you are prepared to spend on acquiring the customer. It is a business decision, usually set with finance, and it should include media and management fees.
An illustration with made-up numbers, not a benchmark: say a customer brings $12,000 of gross profit in year one, 8% of qualified leads become customers, and you are willing to spend 30% of first-year gross profit on acquisition.
$12,000 × 0.08 × 0.30 = $288 per qualified lead
If only 40% of raw form fills turn out to be qualified, the ceiling for a raw lead is $288 × 0.40 = $115.20. Anything under those numbers is profitable at the margin; anything above it needs a better close rate, a higher deal value, or a different channel.
The same arithmetic runs the other way. Customer acquisition cost is cost per lead divided by the lead-to-customer rate, so a $40 lead that closes at 5% is an $800 customer. If a customer is worth $600, that “cheap” lead is losing money.
Two adjustments we make in practice:
- Subtract sales time when it is significant. A lead that takes two calls to disqualify has a cost the ad platform never shows you.
- Use separate rates per channel. Search leads and social leads rarely close at the same rate, so one blended ceiling will overfund one channel and starve the other.
Why does “qualified” matter more than the headline number?
Because the ad platforms optimize toward whatever you count. If every form fill is a conversion, Google’s Smart Bidding and Meta’s delivery system will get very good at finding people who fill in forms, including the ones who never pick up the phone. The headline cost per lead goes down and the pipeline does not move.
That is what we changed for iSoftpull. Instead of letting Meta and Google learn from form fills, we connected both to product-usage data, so the algorithms learned which people actually used the software after signing up. We also cut spend on low-intent audiences. The cost per qualified lead fell from $205.41 to $25.84.
Write your definition of “qualified” down, agree it with sales, and make it a field in the CRM rather than a feeling. Typical criteria are the ones a salesperson would use to decide whether to call back: company type, use case, expected volume, and whether the person can buy. The ladder of metrics then looks like this:
| Metric | What it tells you | Where the number comes from |
|---|---|---|
| Cost per lead | What the platform charged per form fill | Ad platform |
| Cost per qualified lead | What it costs to put a real prospect in front of sales | CRM qualification field + ad spend |
| Cost per opportunity | What it costs to start a real sales conversation | CRM deal stages + ad spend |
| Customer acquisition cost | What a new customer actually cost | CRM closed-won deals + all acquisition spend |
Report the top line if you must, but make decisions on the lower three.
How do offline conversions lower the cost per qualified lead?
By telling the ad platforms which leads were good. When a lead qualifies or a deal closes in your CRM, that event is sent back to Google Ads and Meta along with the click identifier or a hashed email address, so the platforms can tie the outcome to the ad that produced it. Their bidding then favors people who look like your customers instead of people who look like form-fillers.
It is one of the first things we build on a paid engagement, because it is usually the cheapest way to make an existing budget work harder. The full method, including which CRM stages to send, which identifiers to capture and how the timing windows work, is in our guide to sending closed-won deals from HubSpot, Pipedrive or Zoho back to Google Ads and Meta. The tracking underneath it, server-side tagging with a first-party endpoint, is covered in our server-side Google Tag Manager guide.
The order matters, though. TMT Finance shows why: feeding Smart Bidding was only worth doing once the application flow worked. If people cannot get through your form, better signals just help the platform find more people who will fail at it.
When is a high cost per lead perfectly fine?
When the close rate and deal value support it. A credit-data or lending product sold to businesses can carry a cost per qualified lead that would ruin a consumer app, because one customer is worth far more. If the formula above says your ceiling is $400 and you are paying $250, you are not overpaying; you may be underspending.
The opposite case is more common: a channel with an attractive cost per lead that produces almost no customers. That channel is expensive, whatever the dashboard says. We see it most often when a campaign is optimized for raw leads on broad audiences, and the sales team quietly stops calling them.
A high cost per lead is a problem when it comes with a falling lead-to-customer rate, or when, as at TMT Finance, people click and then fail to finish the journey. Both are measurement and funnel questions before they are bidding questions.
How should you track cost per lead month to month?
A few rules that keep the number honest:
- Put platform numbers beside CRM numbers, never instead of them. Each platform counts its own conversions generously, and the totals rarely match what finance sees.
- Group leads by the month they arrived, not the month they closed. With a sales cycle of weeks or months, last month’s spend has not finished producing customers yet.
- Watch volume next to cost. A cost per qualified lead that halves while volume collapses usually means the campaign has narrowed to a handful of cheap leads.
- Keep one UTM convention across every channel, so the CRM knows which campaign each lead came from.
We build this as Looker Studio dashboards per team, with a written note whenever platform and CRM disagree. Our paid advertising and analytics services are set up around exactly that, and the channel detail is on our Google Ads and Meta Ads pages.
FAQ
What is a good cost per lead for fintech?
One that your own close rate and customer value can pay for. Fintech products range from consumer apps to software sold to lenders, so a single number would mislead you. For context only, our client iSoftpull, a B2B credit-data company, reached $25.84 per qualified lead in early 2026, and TMT Finance reached $48.74 per lead. Use the formula above to work out yours.
Is a lower cost per lead always better?
No. A lower cost per lead that comes from looser targeting or a weaker definition of a lead often raises your cost per customer. Optimize for cost per qualified lead and customer acquisition cost, and treat the raw cost per lead as an early warning, not a goal.
How long before we know our real cost per lead?
At least one full sales cycle after the change, and longer for small budgets. Smart Bidding and Meta’s delivery also need a run of conversion data before they settle, so a change in what you count takes a few weeks to show up in the numbers.
Do you publish industry benchmarks for cost per lead?
No. The averages we have seen mix deal sizes, lead definitions and channels so thoroughly that they do more harm than good as targets. We would rather show you what our own clients pay, labelled as theirs, and help you calculate your ceiling. If you want a second opinion on your numbers, our ads audit is free: get in touch.